Whale Activity Checker
Whale Activity Analysis Tool
Determine whether crypto whales are accumulating or distributing based on key metrics. Enter values to see if whales are building positions or preparing to sell.
Analysis Result
Enter values to see analysis
This is a general indicator. Always confirm with multiple sources.
How to Use This Tool
Enter values based on your on-chain data analysis. The most reliable signals align across multiple metrics as described in the article.
- Accumulation indicators: Decreasing exchange inflows, Rising supply per whale, 0.8-1.0 trend score
- Distribution indicators: Increasing exchange inflows, Falling supply per whale, 0.1-0.3 trend score
Remember: One signal alone can be misleading. Wait for three consecutive days of consistent signals before acting.
When you see Bitcoin price stall for weeks while everyone complains about the market being dead, don’t assume it’s over. That quiet phase might be the most dangerous - and profitable - time of the cycle. Behind the scenes, whale accumulation is happening. Big holders are quietly buying, layering in positions while retail traders wait for the next breakout. Then, when the crowd finally jumps in, those same whales start whale distribution - selling slowly, methodically, and often right under the radar.
What Exactly Are Crypto Whales?
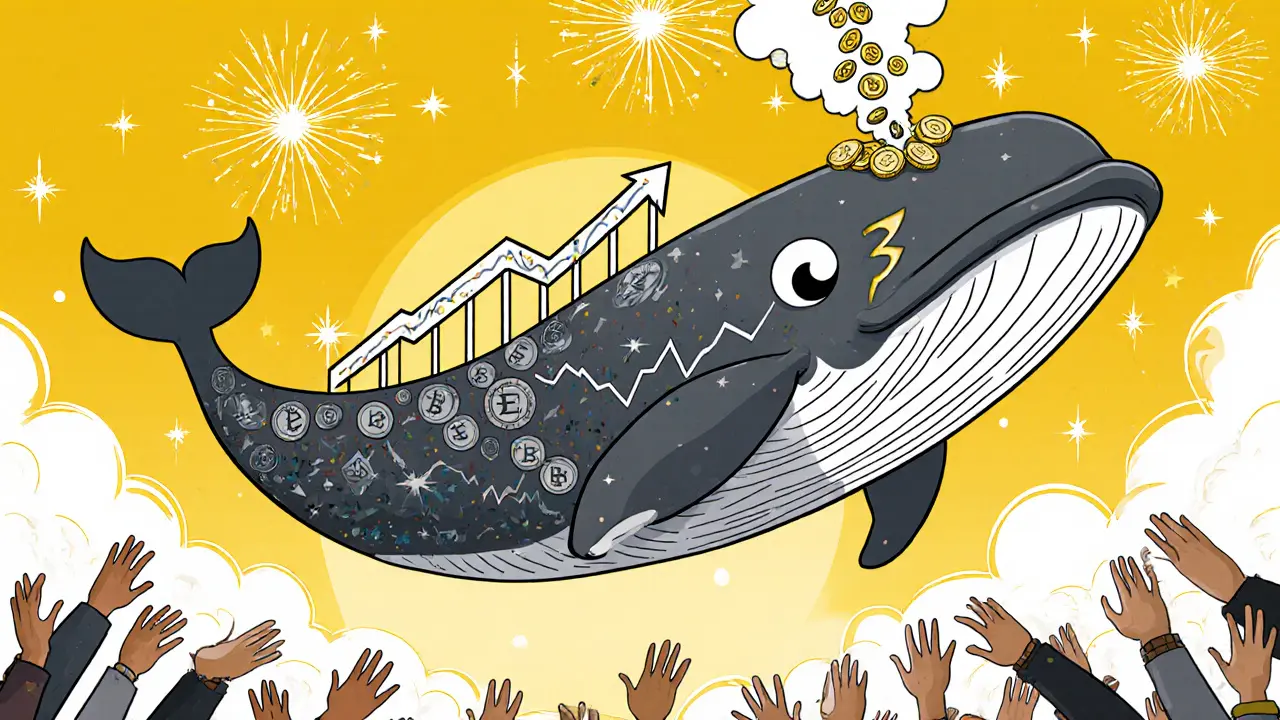
Crypto whales aren’t mythical creatures. They’re real wallets holding massive amounts of cryptocurrency. For Bitcoin, that means addresses with 100 to 10,000 BTC. For Ethereum, it’s wallets holding 5,000 ETH or more. Some altcoins have even lower thresholds - a single wallet with 1% of the total supply can be a whale in a smaller project. These aren’t just rich individuals. Many are institutional funds, crypto-native firms, or early adopters who bought in at $10 or $100 and never sold. They control a significant chunk of the circulating supply. Right now, about 13.5% of all Bitcoin - roughly 4.2 million BTC - is held by these top wallets. That’s more than the entire supply of most altcoins combined. Their size gives them power. When a whale buys 500 BTC in one go, it can push the price up. When they sell 1,000 ETH, it can trigger panic. But they don’t act like retail traders. They don’t click ‘buy’ on Coinbase at market price. They use OTC desks, split orders across dozens of addresses, and time their moves to avoid drawing attention.Whale Accumulation: The Quiet Build-Up
Accumulation is when whales are buying - but not loudly. It happens during sideways markets, after a big drop, or during periods of low volume. The price doesn’t move much. Traders get bored. Social media says it’s dead. That’s when whales are working. They use several tactics:- Buying in small chunks over weeks to avoid spiking the price
- Consolidating UTXOs - combining small Bitcoin holdings into fewer, larger addresses to prepare for future moves
- Buying from exchanges during dips, knowing retail is selling out of fear
- Using decentralized exchanges (DEXs) to avoid leaving traces on centralized platforms
Whale Distribution: The Slow Sell-Off
Distribution is the opposite. It’s when whales start selling - but again, quietly. This usually happens when the market is euphoric. Retail traders are buying. News sites are hyping “new all-time highs.” Social media is flooded with FOMO. That’s when whales cash out. They don’t dump everything at once. That would crash the price. Instead, they:- Send coins to exchanges - not to sell immediately, but to be ready to sell when demand is high
- Create fake buy walls on order books to lure retail buyers in
- Use OTC deals to offload large amounts without affecting the public market
- Time sales around major news events, like Fed announcements or ETF approvals, when attention is high
How to Spot the Difference
You can’t just look at price. You need to look at behavior. Here’s how to tell accumulation from distribution:| Indicator | Accumulation | Distribution |
|---|---|---|
| Price Action | Sideways or slightly declining | Strong uptrend, often near all-time highs |
| Volume | Low to moderate, especially on exchanges | High, driven by retail buying |
| Exchange Inflows | Decreasing - whales are holding | Increasing - whales are moving to exchanges |
| Supply per Whale | Rising - whales are accumulating more | Falling - whales are reducing holdings |
| Whale Trend Score (Glassnode) | 0.8-1.0 | 0.1-0.3 |
| Market Sentiment | Pessimistic, low social media buzz | Overly bullish, FOMO everywhere |
Real Examples: When Whale Tracking Worked (and When It Didn’t)
In February 2023, Bitcoin was stuck between $20k and $23k. Retail traders were giving up. But Glassnode’s Accumulation Trend Score was climbing. By March, Bitcoin broke above $25k - then $30k. One Reddit user tracked the Supply per Whale metric daily and bought in at $21k. He held until $32k. That’s accumulation in action. In July 2023, Bitcoin was at $31k. Whale accumulation signals appeared again. But instead of rallying, Bitcoin dropped to $25k. Why? Because the Fed announced a surprise rate hike. Whale signals didn’t fail - they were just one piece of the puzzle. Macro forces overpowered on-chain behavior. Another case: Ethereum in August 2023. Whale wallets started sending ETH to Coinbase. At the same time, the Whale Trend Score dropped. A few days later, ETH fell from $1,900 to $1,750. Traders who watched the inflows avoided the drop. But here’s the trap: some whales fake signals. They’ll create a big buy order on an exchange, make it look like they’re accumulating, then cancel it. Or they’ll move coins to an exchange, then move them right back. That’s called spoofing. That’s why you need to look at the full picture - not just one chart.
Tools to Track Whales - Free and Paid
You don’t need to pay $1,500 a month to track whales. Start here:- Free: Glassnode’s public charts (Accumulation Trend Score, Supply per Whale), Blockchain.com’s whale tracker, Nansen’s free wallet alerts
- Mid-tier: Bitquery’s free dashboard shows whale tiers (Dolphins, Sharks, Whales)
- Paid: Glassnode Studio ($1,499/month), Nansen ($999/month) - these give real-time alerts, wallet classification, and historical trend analysis
The Bigger Picture: Why This Matters
Whale tracking isn’t about predicting the next moonshot. It’s about understanding who controls the market. Retail traders are the last to know. Whales are the first. Institutional investors are already using this. By 2025, 78% of professional crypto portfolios will rely on whale data as part of their strategy, according to CoinDesk Research. That’s not speculation - it’s adoption. But there’s a catch. Regulators are watching. The SEC subpoenaed OTC desks in 2023. The FATF warned that whale tracking data could be restricted under EU privacy laws. If governments start limiting access to on-chain data, the game changes. Also, whales are getting smarter. They’re using multi-sig wallets, DeFi protocols, and cross-chain bridges to hide their moves. The tools we have today might not work as well in two years. Still, blockchain is transparent by design. As long as transactions are public, someone will find a way to track the big players. The question isn’t whether whale tracking will disappear - it’s whether you’ll learn how to use it before the next cycle.What to Do Next
If you’re a trader:- Start with Glassnode’s free Accumulation Trend Score chart. Bookmark it.
- Check exchange inflows weekly. Use Blockchain.com or Nansen’s free tools.
- Don’t trade on whale signals alone. Combine them with price action, volume, and macro news.
- Wait for three days of clear signals before acting.
- Don’t panic when whales are accumulating during a dip. That’s a sign of strength.
- Don’t get greedy when whales are distributing during a rally. That’s a sign to take profits.
- Remember: whales don’t care about your emotional timeline. They play the long game.





Komal Choudhary
November 28, 2025 AT 05:50Bro I just bought 0.3 BTC at $61k because my cousin said it's 'accumulating'... now it's stuck at $60.5k and I'm crying into my chai. Why does this feel like astrology with charts?
Tina Detelj
November 29, 2025 AT 12:52Ohhhhh, the quiet before the storm-where the whales glide through the abyssal plains of blockchain, their colossal shadows flickering across the UTXO coral reefs like ancient leviathans whispering secrets to the nodes…
Accumulation isn’t just buying-it’s a sacred ritual of patience, a meditation in entropy, where fear is transmuted into silent power. Each tiny transaction, a heartbeat in the pulse of the market’s soul.
And distribution? Ahhh… it’s the slow, elegant unfurling of a velvet claw-gentle, deliberate, devastating. The crowd cheers as the sun rises, unaware the tide has already turned beneath their dancing feet.
It’s not data-it’s poetry written in Satoshi. Glassnode isn’t a tool-it’s a oracle. Supply per Whale? That’s the sacred scroll. The trend score? The breath of the market’s spirit.
And yet… we still cling to candles and RSI like children clutching stuffed animals in a thunderstorm. We forget: the ocean doesn’t care if you believe in tides. It moves anyway.
So I watch. I breathe. I wait. And when the score hits 0.94? I don’t buy. I bow.
Wilma Inmenzo
November 30, 2025 AT 13:36Wait… so you’re telling me the SEC doesn’t know about this? That the Fed isn’t manipulating whale data? That Nansen isn’t owned by the same people who run the Fed’s dark pool? Pfft.
They’re using blockchain to track whales… but what if the whales are THEM? What if the ‘accumulation’ is just a honeypot to lure retail into buying before they trigger a flash crash via quantum algorithms?
And why does every ‘free tool’ ask for my wallet address? Are they harvesting my private keys under the guise of ‘transparency’?
They’re not tracking whales-they’re herding sheep. And the ‘smart money’? Probably just the same 12 hedge funds laundering money through 3,000 dummy wallets. I’ve seen the patterns. This isn’t crypto. It’s a simulation.
Also-why do all these charts look like they were drawn by a toddler on acid? I don’t trust any of it.
priyanka subbaraj
December 1, 2025 AT 20:26WHEN THE WHALES MOVE, THE OCEAN SHAKES.
YOU THINK YOU’RE SMART BECAUSE YOU READ A BLOG?
YOUR PORTFOLIO IS A TOMB.
THEY’RE BUYING. YOU’RE SCROLLING.
THEY’RE SELLING. YOU’RE SAYING ‘TO THE MOON’.
YOU DON’T SEE IT BECAUSE YOU’RE TOO BUSY POSTING MEMES.
WHEN YOU’RE BROKE, DON’T COME CRYING TO ME.
THEY’RE NOT WHALES.
THEY’RE GODS.
AND YOU? YOU’RE A BUBBLE.
George Kakosouris
December 2, 2025 AT 05:57Let’s cut through the noise here-accumulation isn’t some mystical ‘trend score’-it’s a liquidity arbitrage play disguised as on-chain analytics.
Whales aren’t ‘patient’-they’re front-running retail FOMO via OTC desks with zero transparency. Glassnode’s metrics? Built on biased UTXO clustering algorithms that misclassify exchange hot wallets as ‘whales’-which is why you see false positives during exchange liquidity crunches.
And distribution? It’s not ‘euphoria’-it’s market makers dumping into ETF inflows during institutional rebalancing windows. The 3-7 day lag? That’s just the settlement delay on Binance’s internal matching engine.
Don’t get fooled by ‘smart money’ labels-Nansen’s clustering is trained on historical data from 2021, when whales operated differently. Today? Most ‘whale’ wallets are just DeFi liquidity pools or custodial hot wallets.
And ‘three-day confirmation’? That’s a lagging indicator. You’re already 20% behind the curve. If you’re not using real-time on-chain order flow with delta analysis, you’re trading with a blindfold.
Bottom line: This isn’t a strategy-it’s a narrative built by content farms to sell subscriptions. If you’re not coding your own node and parsing raw blockchain data, you’re just paying for a fortune cookie.
Tony spart
December 3, 2025 AT 10:39americans think theyre so smart with their ‘on chain data’ and ‘glassnode’ but the real whales? they’re in china and russia and they dont even use btc they use monero and zcash and the us gov cant even track em. you guys are analyzing ghosts.
also why do you think the fed cares about your ‘whale trend score’? they printed 5 trillion and you think a few crypto wallets matter? lol.
the only thing that matters is the dollar. everything else is a casino. and if you’re betting on crypto because some reddit guy said ‘whales are accumulating’-you deserve to lose.
also i heard nansen is owned by jews. just saying.