
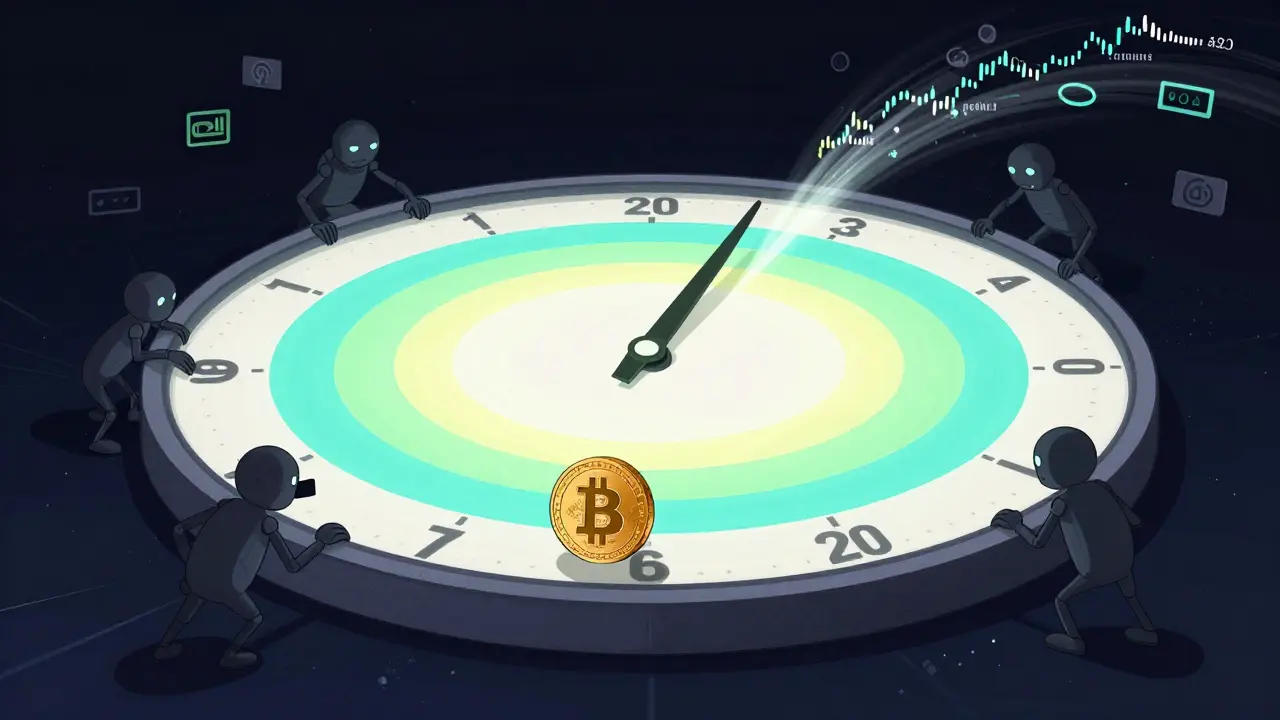
When you look at a cryptocurrency price chart, you’re seeing only half the story. The real action happens behind the scenes-in the order book data. This isn’t just another chart or indicator. It’s the live, breathing record of every buy and sell order waiting to be filled. In markets like Bitcoin or Ethereum, where liquidity can shift in seconds, understanding order book data isn’t optional-it’s the difference between making a smart trade and getting caught off guard.
What Exactly Is an Order Book?
An order book is a real-time list of all pending buy and sell orders for a specific asset. Think of it like a digital marketplace where buyers and sellers are constantly negotiating prices. On one side, you have bids: the prices people are willing to pay to buy. These are listed from highest to lowest. On the other side, you have asks: the prices sellers are asking for. These go from lowest to highest. The gap between the highest bid and the lowest ask? That’s the bid-ask spread. A narrow spread usually means the market is liquid and stable. A wide one? That’s a red flag-fewer people are trading, and prices can jump unpredictably.
Each order includes not just a price, but a quantity. If 12 BTC are being bid at $65,000, and another 8 BTC at $64,950, the order book shows both. This isn’t just a list-it’s a map of market depth. And that depth tells you whether a large trade will move the price or slide through smoothly.
Why Order Book Data Beats Price Charts Alone
Most traders start with candlestick charts. They look at highs, lows, moving averages. But those only show what already happened. The order book shows what’s about to happen.
For example, if you see a wall of buy orders-say, 500 BTC stacked at $64,800-that’s a strong support level. Even if the price dips there, it’s likely to bounce because so many buyers are waiting. Conversely, a thick cluster of sell orders at $66,000? That’s resistance. Price might struggle to break through.
Traditional volume indicators tell you how much traded in the last hour. Order book data tells you how much is ready to trade right now. That’s why professional crypto traders watch order books before entering big positions. If you’re planning to buy 10 BTC and the top ask is only 2 BTC, you’ll need to sweep through multiple price levels. That can spike the price-and cost you more than you expected.
Reading Market Sentiment Through Order Flow
Order book data doesn’t just show prices-it reveals sentiment. A heavily loaded bid side? That’s bullish. Sellers are scarce, buyers are piling in. A deep ask side with few bids? Bearish. People are scared to buy.
But there’s more. Watch the flow. Are large orders appearing and vanishing quickly? That could be spoofing-traders placing fake orders to trick others into moving, then canceling before execution. It’s illegal in regulated markets, but still common in crypto. A sudden surge of small buy orders piling up at one price? That’s often retail traders reacting to news. A single large buy order hitting the ask? That’s a whale moving in.
Platforms like Coinbase and Binance show order books with color coding-green for bids, red for asks. But don’t just look at colors. Look at the numbers. Is the top bid 10 BTC or 500 BTC? The difference changes everything.

How Order Book Data Powers Trading Strategies
Professional traders don’t guess. They use order book data to build strategies:
- Market Depth Analysis: How much volume exists at 5, 10, or 20 price levels away from the current price? If depth drops sharply after the top 3 levels, the market is thin. Avoid large trades.
- Volume-Weighted Average Price (VWAP): Used for executing large orders without moving the market. By spreading buys across multiple price levels based on order book depth, traders minimize slippage.
- Order Flow Imbalance: If buy orders are accumulating faster than sell orders over a 30-second window, momentum is shifting. This can signal a breakout before price even moves.
- Level 2 Trading: Many platforms offer Level 2 data, which shows the top 10-50 bids and asks. This is the minimum you need to trade effectively in crypto.
High-frequency trading firms use machine learning to scan order book changes at microsecond speeds. They don’t wait for price to move-they predict it by watching how orders change before they’re filled. You don’t need that kind of tech to start, but you do need to understand the patterns they’re chasing.
Challenges and Pitfalls
Order book data is powerful-but it’s noisy. In a volatile market, orders appear and disappear faster than you can blink. A large bid might vanish in 200 milliseconds. What looked like support could evaporate before you click buy.
Another problem? Information overload. Seeing 200 price levels with numbers scrolling past is overwhelming. That’s why traders use tools that aggregate data-showing cumulative volume at key levels instead of every single order. A good platform will let you zoom in on the most relevant zones: the top 10-20 levels.
And don’t forget manipulation. Spoofing is real. Someone places a huge sell order at $67,000 to scare buyers, then cancels it and buys at $66,500. Without understanding the context, you’ll think the market is crashing. Always check if large orders are being canceled repeatedly. Look for patterns, not single snapshots.
Tools and Platforms That Show Order Book Data
Not all exchanges show order books the same way. Here’s what to look for:
- Bybit, Binance, Coinbase: Offer full Level 2 order books with color-coded depth charts. Coinbase’s interface is especially clean for beginners.
- TradingView: Lets you overlay order book data on price charts (if your broker supports it).
- Depth charts: These visualize cumulative volume across price levels. A steep curve means liquidity drops fast. A flat curve means deep market.
- Third-party tools: Like CryptoQuant or LunarCrush, which combine order book data with social sentiment and on-chain metrics.
Start with one platform. Master its interface. Learn how the numbers change during quiet hours versus high-volume periods. Practice reading the book during low volatility before testing it in a pump or dump.
The Future of Order Book Analysis
Crypto markets never sleep. That means order book data streams 24/7-unlike stocks or forex. This continuous flow is fueling new tools: heatmaps that show where liquidity clusters, AI models that predict short-term price moves based on order imbalance, and cross-exchange analysis that compares BTC order books on Binance, Kraken, and Coinbase simultaneously.
Regulators are also paying attention. The SEC and other global bodies are pushing for better transparency to prevent spoofing and front-running. That means order book data will become more standardized, and access will improve for retail traders.
One thing won’t change: the order book remains the most honest reflection of supply and demand. No indicator, no bot, no news headline tells you what traders are really thinking-except the order book.
What’s the difference between order book data and trading volume?
Trading volume shows how much has already been bought and sold. Order book data shows what’s still waiting to be traded. Volume is history. Order book data is the future.
Can I trade crypto effectively without looking at the order book?
You can, but you’re flying blind. Many retail traders lose money because they only follow price charts and news. The order book reveals hidden support and resistance, liquidity gaps, and manipulation. Without it, you’re guessing.
Why do order book levels change so fast in crypto?
Crypto markets are global and operate 24/7 with high participation from both retail traders and automated bots. Orders are placed, canceled, and adjusted in milliseconds. High-frequency trading algorithms react to small changes faster than humans can see. This creates a constantly shifting landscape.
How do I avoid being fooled by fake orders (spoofing)?
Watch for large orders that appear and vanish within seconds, especially right before a price move. Use cumulative depth charts instead of raw order lists. If a big bid suddenly disappears and price drops, it’s likely spoofing. Wait for confirmation-look for sustained volume or price action before acting.
Is order book data useful for long-term investors?
Less so for pure buy-and-hold investors, but still valuable. If you’re planning to enter or exit a position, knowing where liquidity is deep can help you avoid slippage. Even long-term investors benefit from understanding market depth before making large trades.


yogesh negi
February 20, 2026 AT 09:47Guys, I’ve been trading crypto for 7 years now, and let me tell you-order books are where the real magic happens. I started out just looking at candlesticks like everyone else, but once I learned to read the depth, everything changed. I stopped getting stopped out on fake breakouts. I started catching reversals before the chart even blinked. It’s like learning to read body language instead of just listening to words. You don’t need a PhD, just patience and a good platform. Start with Binance’s depth chart. Watch it during quiet hours. See how the bids and asks dance. It’s hypnotic. And yeah, I know some people say it’s overkill-but if you’re serious about not getting roasted by whales, this is your new bible.
Tarun Krishnakumar
February 21, 2026 AT 01:02Of course they’re telling you to ‘watch the order book’-because that’s what the exchanges want you to do. They feed you Level 2 data like it’s free wisdom, but the truth? The data you see is already filtered, delayed, and sometimes outright manipulated by their own algo bots. Ever wonder why that ‘massive buy wall’ at $65K always vanishes right before the pump? Yeah. That’s not luck. That’s orchestrated. The SEC doesn’t regulate crypto order books because they can’t. The system’s rigged. You think you’re reading the market? You’re reading a mirror held up by a casino that owns the mirror, the light, and the damn room. Stick to Bitcoin and cash out every full moon. That’s the only strategy that survives.
jennifer jean
February 21, 2026 AT 20:29OMG I love this so much 💖 I just started trading last month and I was so confused why my buys kept getting wrecked-then I looked at the order book and saw this huge sell wall I didn’t even know was there 😭 Now I wait for the wall to thin out before I enter. It’s like reading emotions in a person’s face instead of just their words. I even made a little spreadsheet to track depth changes over time. It’s nerdy but so satisfying 🤓
Ruby Ababio-Fernandez
February 23, 2026 AT 08:05Order books are useless. Just buy the dip. Sell the rip. Done.
Dominica Anderson
February 24, 2026 AT 22:37How quaint. You treat order books like some kind of mystical oracle. The truth? It’s just noise filtered through a capitalist lens. The ‘depth’ you admire is a performance art piece curated by hedge funds with server farms in Iceland. You’re not reading market sentiment-you’re reading the echo of a trillion-dollar machine that doesn’t care if you live or die. If you want truth, go study Marx. Or better yet-stop trading and get a real job.
Lisa Parker
February 25, 2026 AT 05:39Ugh I tried looking at the order book once and I just cried. Too many numbers. Too much pressure. I just want to click buy and feel good. Why does everything have to be so complicated?? 😭
Ian Plunkett
February 27, 2026 AT 03:32Let me tell you something about order books, folks. I’ve seen them collapse in under 47 milliseconds during the 2021 Dogecoin frenzy. I was on the other side of that trade. I watched a 300 BTC bid evaporate like it never existed-then the price dropped 12%. That’s not volatility. That’s surgical sabotage. And no, the exchanges don’t warn you. They profit from your confusion. I use a custom Python script now to monitor cancellations in real time. If a single large order vanishes twice in 90 seconds? I short it. It’s not gambling. It’s forensics.
Sasha Wynnters
February 27, 2026 AT 08:18The order book isn’t data-it’s poetry written in liquidity and fear. Each bid is a whispered hope. Each ask, a clenched fist. The spread? That’s the silence between heartbeats. You think you’re trading Bitcoin? No. You’re trading human psychology, compressed into decimal points and millisecond delays. The whales don’t move markets-they conduct them. And you? You’re the audience, clapping along to a symphony you didn’t write. But here’s the twist: if you learn to listen, you can start humming the melody too. Not with algorithms. Not with charts. With presence.
Anandaraj Br
March 1, 2026 AT 01:05Chris Thomas
March 1, 2026 AT 09:20Order book analysis without institutional-grade latency optimization is like using a slide rule to navigate a supersonic jet. You're not 'reading the market'-you're engaging in a high-stakes game of Russian roulette with millisecond timing, where the chamber is loaded by HFT firms with direct exchange co-location. Level 2 data? That's toddler-level. If you're not processing nanosecond-order events with a low-latency C++ feed and a custom VWAP engine, you're not trading-you're donating. And yes, I've built three of them. And no, I won't share the code. You're not ready.