When you place a trade on a crypto exchange, you’re not just buying or selling at the price you see. You’re stepping into a hidden system of buy and sell orders stacked like layers in a cake. That’s market depth-and if you ignore it, you’re trading blindfolded.
What Market Depth Really Means
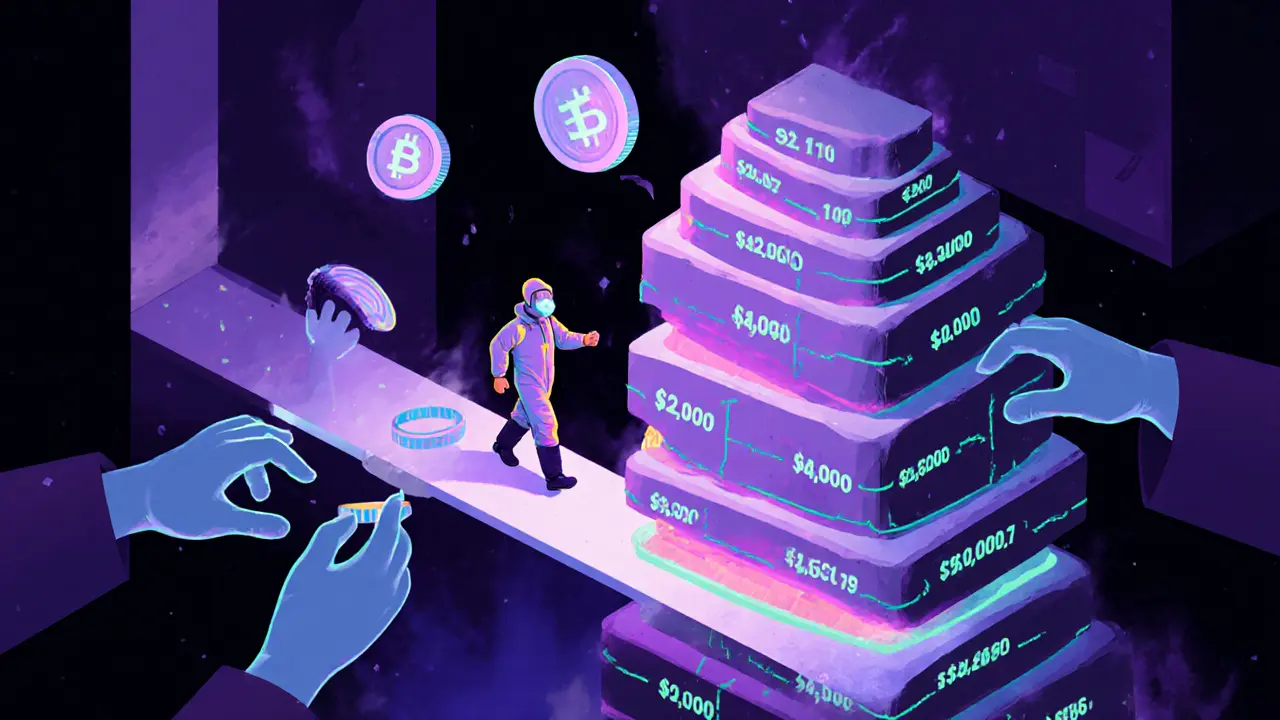
Market depth is the visible stack of buy and sell orders at every price level in the order book. It shows you how much of an asset traders are willing to buy or sell at $100, $101, $102, and so on. Think of it like a grocery store checkout line: the longer the line, the more people are ready to buy or sell. A deep market has thick lines on both sides-lots of orders waiting to be filled. A shallow market? One or two people at the counter. One big order, and the price shoots up-or crashes. In traditional markets like U.S. Treasuries, a $1 million trade might move the price less than 0.1%. That’s deep. In Bitcoin? A $1 million trade can push the price 1% or more. That’s shallow. And that’s the difference between a market that can handle volume and one that snaps under pressure.How Liquidity Is Measured: The 2% Depth Rule
Traders don’t just look at the top bid and ask. They zoom out. The industry standard is the 2% depth-the total volume of orders within 2% above and below the current price. It’s not about what’s right in front of you; it’s about what’s waiting just beyond. For example, as of Q3 2024, Bitcoin on Coinbase Pro had a median 2% depth of $8.7 million. That sounds like a lot-until you compare it. Apple stock on NASDAQ? $42.3 million. U.S. 10-year Treasury notes? $1.2 billion. Bitcoin’s depth is 99.3% thinner than Treasuries. That’s not a typo. It means even moderate-sized trades can cause big price swings. This is why large crypto buyers often split their orders. A $500,000 buy order on a shallow market doesn’t just get filled-it drags the price up as it eats through every buy order below it. That’s slippage. And slippage eats profits.Depth of Market (DOM): The Real-Time Ladder
Most trading platforms show you a Depth of Market (DOM) ladder-a live feed of buy and sell orders stacked vertically. The left side shows bids (buyers), the right side shows asks (sellers). Each row is a price level. The number next to it is how much is available at that price. A trader using DOM sees more than price. They see pressure. If you notice 1,200 BTC sitting at $61,500 on the bid side, and nothing above it, that’s a magnet. It suggests strong support. If that pile vanishes suddenly? That’s often spoofing-fake orders placed to trick others into thinking there’s demand, then pulled before execution. Professional traders watch DOM like a hawk. A Reddit user called QuantTrader87 spotted persistent buy orders at $152.35 on SPY over three days. He entered a swing trade, and made 3.2%. That wasn’t luck. It was reading depth.Why Crypto Markets Are So Shallow
Crypto markets are fragmented. Bitcoin trades on Binance, Coinbase, Kraken, OKX, Bybit-and each has its own order book. Liquidity isn’t pooled. It’s scattered. So even if Binance has $50 million in depth, you can’t access it all from one platform. Add to that: most retail traders use basic charting tools. They don’t have direct market access (DMA). They don’t see hidden orders. And they don’t realize that high-frequency trading firms are placing iceberg orders-tiny visible slices of huge hidden stacks-to manipulate the DOM. Stanford finance professor Dr. Emily Zhao warns: “Overreliance on visible market depth can be dangerous.” What looks like strong support? Could be a trap. What looks like a wall of sell orders? Might be a decoy.
The Hidden Cost: Spoofing and Liquidity Fragility
In March 2023, the U.S. Treasury market saw its 2% depth collapse from $1.5 billion to $187 million in minutes. The market looked deep-until it wasn’t. That’s liquidity fragility. And crypto experiences this daily. On TradingView forums, users reported crude oil futures orders at $78.50 vanishing right before their buy orders hit. Losses averaged 1.8 ticks per contract. Same thing happens in crypto. You see a wall of buy orders at $60,000. You place your limit order. The wall disappears. Price drops to $59,800. You’re filled at a worse price than expected. That’s not a glitch. That’s manipulation. The International Organization of Securities Commissions found that 41.7% of visible market depth in equity markets disappears within half a second. Crypto? Likely higher. Algorithms are faster than humans. They see your order coming-and erase the depth before you can act.Who Uses Market Depth Analysis-and Why
Institutional traders? They live by it. JPMorgan analyzes depth for over 12,000 securities daily. They use it to schedule trades during peak liquidity, avoid slippage, and reduce costs. Fidelity’s new “Smart Depth Router” uses real-time DOM to execute 68% of large orders with 19.4% less shortfall than traditional methods. Retail traders? Only the disciplined ones. According to a Tabb Group survey, top professional traders spend 15-20% of their pre-market time analyzing depth. They don’t just look at candles. They scan the order book. They wait for accumulation. They avoid trading when depth is thin. The CFA Institute found that 89% of institutional trading desks use depth metrics in their algorithms. But they also warn: retail traders misread DOM. They think a big buy wall means the price will rise. It doesn’t. It might mean someone’s about to dump.Tools and Costs: Can Retail Traders Afford It?
Professional DOM tools aren’t cheap. Bookmap costs $299/month. Quantower is $149/month. NinjaTrader and TradingView Pro are better options-but still cost $50+ monthly. Then there’s the data feed. Direct market access to exchanges like Binance or Coinbase Pro? $300-$500/month. That’s more than most retail traders make in a month. Most free platforms show only the top 5-10 levels. You’re seeing 10% of the picture. To get real depth, you need Level 2 data-and that’s locked behind paywalls. But you don’t need to break the bank. Start with TradingView’s free DOM. Watch how orders behave around key price levels. Practice on a demo account for 3 months. Learn to spot iceberg orders-small visible chunks with long tails of hidden volume. Watch for sudden removal of large orders. That’s your signal to pause.
How to Start Using Market Depth Today
1. Open your exchange’s DOM view-even if it’s basic. Look at BTC-USD or ETH-USD. 2. Find a key support or resistance level-say, $60,000 for Bitcoin. 3. Watch the depth for 10 minutes. Are buy orders building? Are they disappearing? Are they being replaced? 4. Check the 2% depth. If it’s under $5 million on BTC, avoid large orders. Wait for a dip in volatility. 5. Don’t chase price. If the price spikes and the DOM shows thin bids, it’s likely a pump-and-dump. Wait for real accumulation. 6. Use volume profiles alongside DOM. High volume at a price? That’s real liquidity. Low volume? It’s noise.The Future: AI and Liquidity Prediction
The next wave isn’t just watching depth-it’s predicting it. Tools like Tradespoon’s DeepLiquidity AI, launched in August 2024, use machine learning to forecast depth changes with 73.2% accuracy. It doesn’t just show you what’s there. It tells you what’s coming. Regulators are catching up too. After the March 2023 Treasury crash, the SEC proposed rules requiring standardized depth disclosures. The Basel Committee is pushing for depth analysis to become mandatory for all major liquidity providers by 2025. Crypto won’t be left behind. As institutional money flows in, exchanges will be forced to improve transparency. Better depth data will come. But until then, you’re on your own.Final Thought: Depth Is Power
Price tells you where an asset is. Depth tells you why it got there-and where it’s going next. In crypto, where volatility is the norm and manipulation is common, depth analysis isn’t optional. It’s survival. You don’t need to be a quant. You don’t need a $300/month platform. You just need to look beyond the price chart. Watch the orders. Learn the patterns. Respect the shallow waters. And never, ever assume that what you see is what’s there.What is the difference between market depth and liquidity?
Market depth is the visible order book-how many buy and sell orders exist at each price level. Liquidity is the broader ability of the market to absorb trades without big price moves. Depth is one measure of liquidity, but not the whole picture. A market can have deep order books but still be illiquid if orders are fake or disappear quickly.
Why does market depth matter in crypto trading?
Crypto markets are shallow compared to stocks or bonds. A $100,000 trade can swing the price by 1-3%. Market depth helps you avoid getting filled at terrible prices. It shows you where real support and resistance lie-and where manipulators are hiding fake orders.
Can I trust the depth shown on my exchange?
Not always. High-frequency traders use spoofing-placing large orders they never intend to fill-to trick others. They create fake depth, then pull it just before your trade executes. Always cross-check depth with volume and price action. If a big buy wall disappears after you place your order, it was likely spoofed.
What’s a good 2% depth for Bitcoin?
As of Q3 2024, Bitcoin’s median 2% depth on major exchanges was around $8.7 million. Anything under $5 million is considered shallow and risky for large trades. For context, Apple stock has over $40 million at the same 2% level. Higher depth means less slippage and more reliable price movement.
Do I need expensive tools to analyze market depth?
No. You can start with free tools like TradingView’s DOM or your exchange’s built-in order book. The key isn’t the tool-it’s the practice. Spend 15 minutes a day watching how depth behaves around key prices. Learn to spot spoofing. Practice on a demo account. Real proficiency comes from observation, not expensive software.
How can I tell if depth is real or fake?
Look for consistency. Real depth stays put or grows slowly. Fake depth vanishes quickly-often right before a price move. Watch the time between order placement and removal. If large orders disappear in under 2 seconds, it’s likely spoofing. Also, check volume: if depth is high but volume is low, the orders aren’t being filled. That’s a red flag.


Rachel Thomas
November 29, 2025 AT 05:14Everyone’s acting like depth is some secret sauce, but let’s be real-most of you are just staring at a chart like it’s a magic 8-ball. I’ve seen buy walls vanish faster than my ex’s apology. It’s not analysis, it’s gambling with extra steps.
Sierra Myers
November 29, 2025 AT 14:04Okay but have you actually checked the 2% depth on Kraken vs Binance? They’re not even close. I checked BTC last week and the spread was wild-like, $60k on one, $59.8k on the other. You think you’re trading Bitcoin, but you’re really trading exchange-specific illusions.
SHIVA SHANKAR PAMUNDALAR
November 30, 2025 AT 06:20Market depth is just a mirror of human greed. We see orders, we project meaning, we forget that behind every bid is someone who wants your money more than you want their asset. The numbers don’t lie-but the people behind them? They’re liars in algorithmic suits.
Shelley Fischer
December 1, 2025 AT 11:39While the article presents a compelling case for market depth analysis, it fails to adequately address the regulatory asymmetry between traditional markets and crypto. The SEC’s proposed disclosures are a step forward, yet crypto exchanges remain largely unregulated in their order book transparency. This imbalance undermines any claim of ‘fair access’ for retail participants.
Puspendu Roy Karmakar
December 3, 2025 AT 03:55Bro, you don’t need fancy tools. I started with TradingView free DOM and just watched BTC around $60K for a week. Saw the same fake buy wall disappear three times. I didn’t trade until the fourth time-when the wall stayed and volume spiked. Made 5% in two hours. It’s not rocket science. Just pay attention.
Evelyn Gu
December 3, 2025 AT 17:19I just want to say… I’ve been watching depth for months now… and honestly… I think… I’m starting to understand it… like, not just the numbers, but the rhythm… the way orders breathe… like a heartbeat… sometimes it’s calm… sometimes it’s panicked… and when it’s panicked… you can feel it… like… you’re not just looking at a screen… you’re listening… to the market… and… I don’t know… it’s kind of beautiful… in a terrifying way…
Michael Fitzgibbon
December 4, 2025 AT 16:42There’s something quietly profound about how much we’ve outsourced our intuition to charts and order books. We used to read body language. Now we read bid-ask spreads. I’m not saying it’s bad-just… ironic. The more data we get, the less we trust our gut. And yet, the most reliable traders I know? They still pause. They breathe. They wait. Maybe depth doesn’t tell you what to do… it just tells you when not to move.
Komal Choudhary
December 4, 2025 AT 23:11Wait, so if I’m using Binance and I see $10M in depth, but the real liquidity is split across 5 exchanges, then technically I’m trading in a ghost market? That’s wild. So like… am I even trading Bitcoin or just… a shadow of it? Someone explain this to my mom.