Liquidity Analysis: What It Really Means for Crypto Investors
When you hear liquidity analysis, the process of measuring how easily a crypto asset can be bought or sold without affecting its price. Also known as market liquidity, it's the invisible force that decides whether your trade goes through smoothly or gets stuck in a dead market. Most new traders focus on price charts and hype, but the real story is in the depth behind the numbers. A coin can spike 50% in a day—but if there’s no liquidity, that rally is a trap. You can’t sell when you need to, and the next buyer might be nowhere to be found.
Liquidity analysis isn’t just about trading volume. It’s about trading volume, the total amount of a crypto asset traded over a set period, how deep the buy and sell orders are, and whether those orders are real or just fake listings. Look at a coin with $10 million in daily volume—sounds good, right? But if 90% of that comes from one whale dumping into a bot-run order book, you’re not trading a market, you’re trading a puppet show. That’s why market depth, the visible stack of buy and sell orders at different price levels matters more than headlines. Real liquidity shows you how much it costs to move the price up or down. A shallow order book? That’s a red flag. A thin spread between bid and ask? That’s a sign of healthy activity.
Most of the coins you’ll find in this collection—like SakeToken, Moonft, or FOC—have near-zero liquidity. Their prices bounce around because no one’s actually trading them. Scammers love these coins because they can pump the price with a few fake buys, then vanish. Meanwhile, platforms like PancakeSwap on Linea or a real DEX with verified volume? They survive because users can trade without fear. Even the biggest crypto bans in Bangladesh or Turkey don’t stop people from trading—they just push them toward platforms with real liquidity. And when regulators freeze $150 million in assets in the Philippines, it’s always the illiquid, unverified tokens that vanish first.
You don’t need to be a quant to do liquidity analysis. Start simple: check the order book on any exchange. If the top buy order is 100 times smaller than the top sell order, walk away. Look at the 24-hour volume on CoinMarketCap—then compare it to the number of unique wallets trading it. If volume is high but wallets are low, it’s likely wash trading. The posts below show you exactly which tokens have real liquidity, which ones are ghosts, and how to spot the difference before you invest. This isn’t theory—it’s survival.
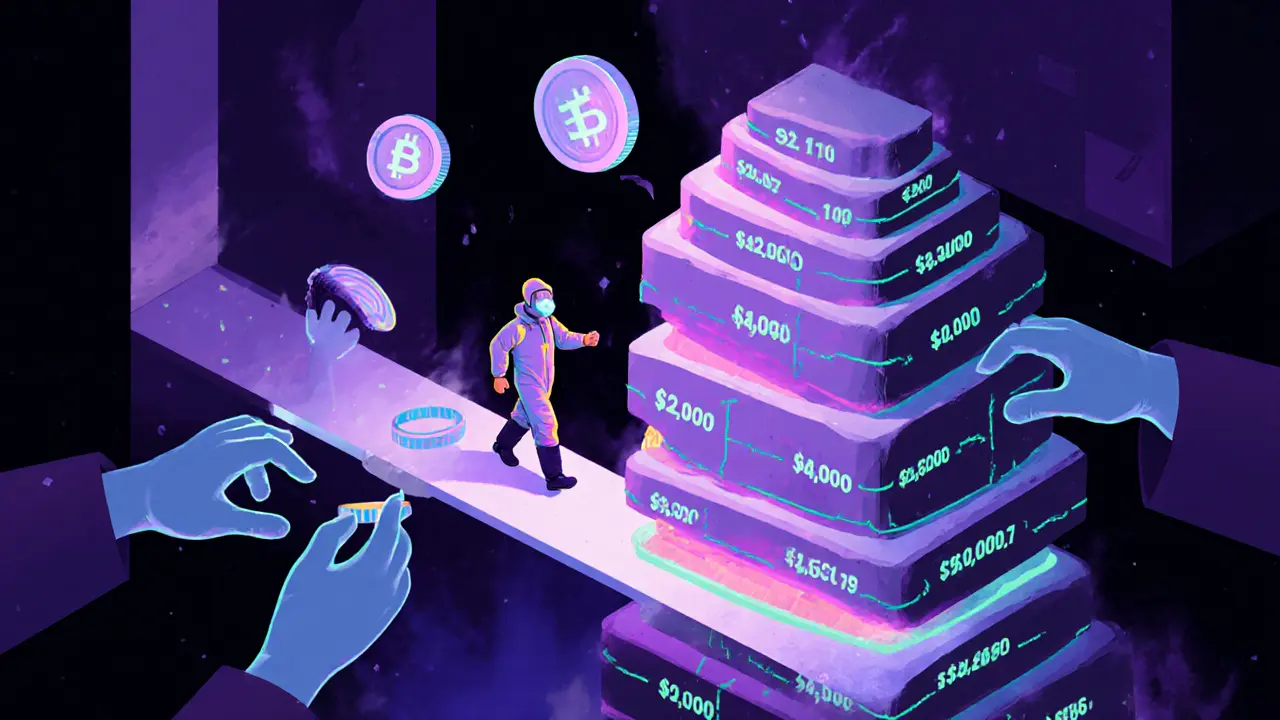
Market Depth and Liquidity Analysis in Blockchain Trading
Market depth and liquidity analysis reveal how much buying and selling pressure exists at every price level in crypto markets. Learn how to read order books, spot spoofing, and avoid slippage with real data from Bitcoin, Treasuries, and institutional trading practices.